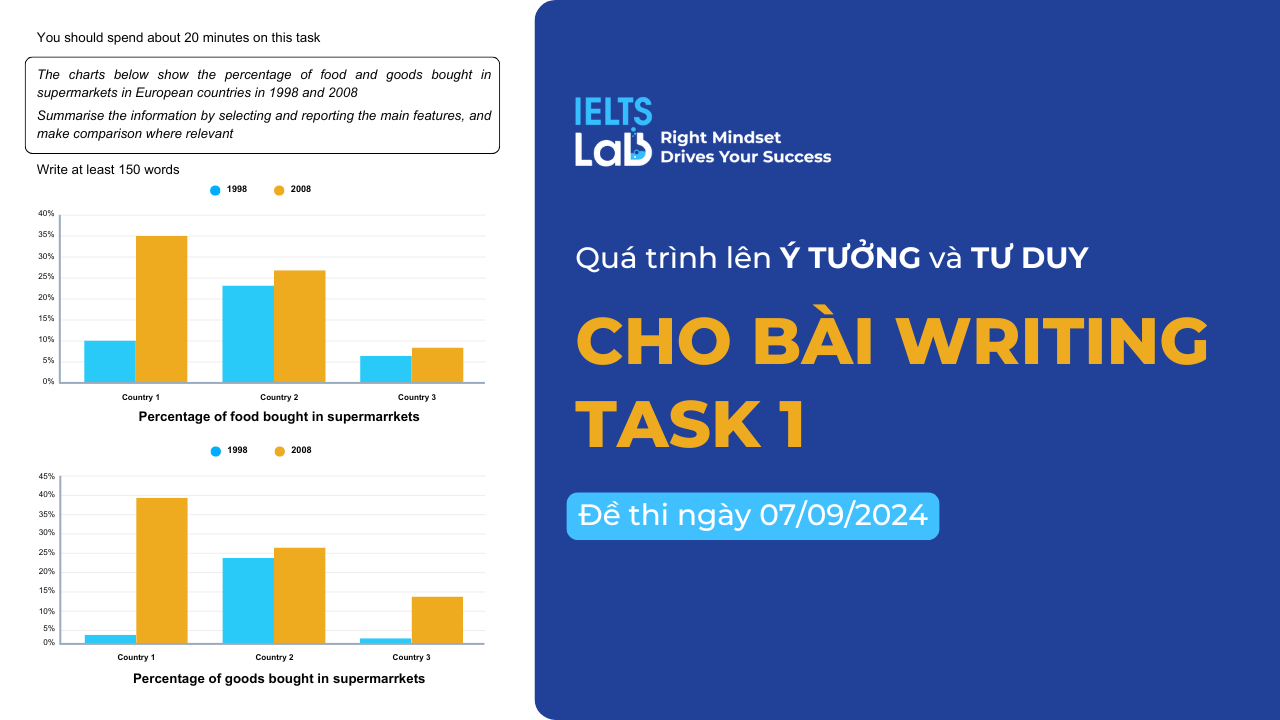
Đề thi ngày 07/09/2024: The charts below show the percentage of food and goods bought in supermarkets in European countries in 1998 and 2008. Summarise the information by selecting and reporting the main features, and make comparisons where relevant.
1. Brainstorm
Khi tiếp cận bài thi IELTS Writing Task 1, điều đầu tiên mình làm là phân tích biểu đồ để nắm bắt các thông tin quan trọng nhất. Với bài viết về biểu đồ này, mình đã có những bước tư duy như sau:
- Đọc kỹ yêu cầu đề bài: Đề yêu cầu so sánh các thay đổi về tỷ lệ mua sắm qua hai năm 1998 và 2008, vậy mục tiêu chính là nhìn nhận sự thay đổi và xu hướng chính ở từng quốc gia.
- Quan sát tổng quan (Overview): Biểu đồ cho thấy rõ rằng, ở cả 3 quốc gia, tỷ lệ mua thực phẩm và hàng hóa ở siêu thị đều tăng lên theo thời gian. Tuy nhiên, mức độ tăng lại khác nhau giữa các quốc gia. Trong đó, country 1 cao nhất, theo sau bởi country 2, và cuối cùng thấp nhất là country 3.
- Sắp xếp ý chính trong thân bài:
Do bài này có 2 biểu đồ nói về 2 mặt hàng khác nhau -> không phù hợp để so sánh, mình đơn thuần chỉ tách mỗi đoạn một biểu đồ rồi viết lần lượt.
- Body 1: Food bought in supermarkets – Mình tả lần lượt từng quốc gia, vừa tả vừa so sánh cao thấp và miêu tả số liệu tăng ra sao.
- Body 2: Goods bought in supermarkets – Mình viết tương tự như Body 1, nhưng đưa thêm sự so sánh về việc xu hướng giữa mua Food và Goods là giống nhau.
2. Bài mẫu
The given bar chart illustrates the rising dominance of supermarkets regarding food and goods purpchases across three European countries between 1998 and 2008.
Overall, it is clear that supermarkets had progressively gained a higher market share in selling food and goods across all 3 examined nations, despite to varying extents. Specifically, supermarkets were most prevalent among consumers in country 1, while country 3 displayed the lowest level of supermarket reliance.
With regards to food, 10% of food bought in country 1 was from supermarkets, which then increased remarkably to a staggering 40% 10 years later, registering as the highest figure across the chart. Country 2 followed a similar pattern, rising moderately from around 25% to over 30% in the same time period. By contrast, country 3 showcased the least interest in buying from supermarkets, witnessing only a modest growth from about 5% to over 10% in the examined years.
As for goods, supermarkets once again displayed dominance in country 1, owning about 20% of the market in 1998, before rising to nearly 60% by 2008. Similarly, country 2 recorded a significant climb in its supermarket share, growing from approximately 40% to about 50% after 10 years. Finally, a neligible 3% was seen in the corresponding figure for country C in 1998, which grew to about 10% by 2008, reflecting a minimal shift in consumer preference toward supermarkets.


Trả lời